gvSIG is a Geographic Information System (GIS), that is, a desktop application
designed for capturing, storing, handling, analyzing and deploying any kind of
referenced geographic information in order to solve complex management and
planning problems. gvSIG is known for having a user-friendly interface, being
able to access the most common formats, both vector and raster ones. It
features a wide range of tools for working with geographic-like information
(query tools, layout creation, geoprocessing, networks, etc.), which turns
gvSIG into the ideal tool for users working in the land realm.
This quickstart describes how to...
- Add projection, raster and vector data to a view
- Navigate around
- Change layers
- Select features
- Create a map with a graticule
- Save the project and exit gvSIG
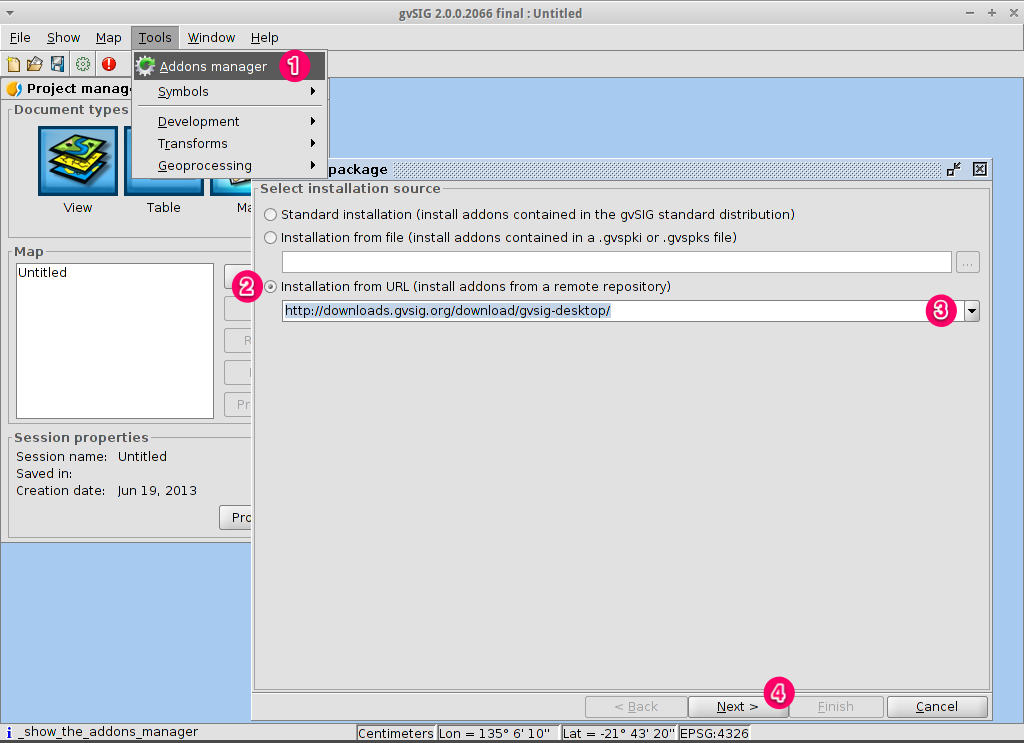
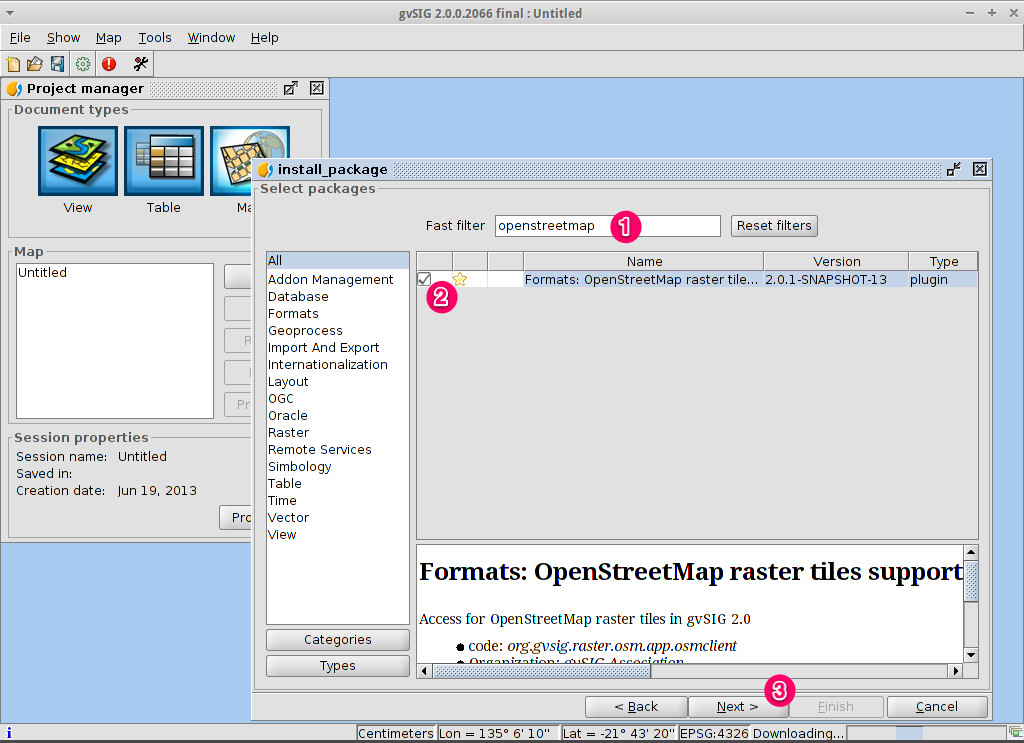
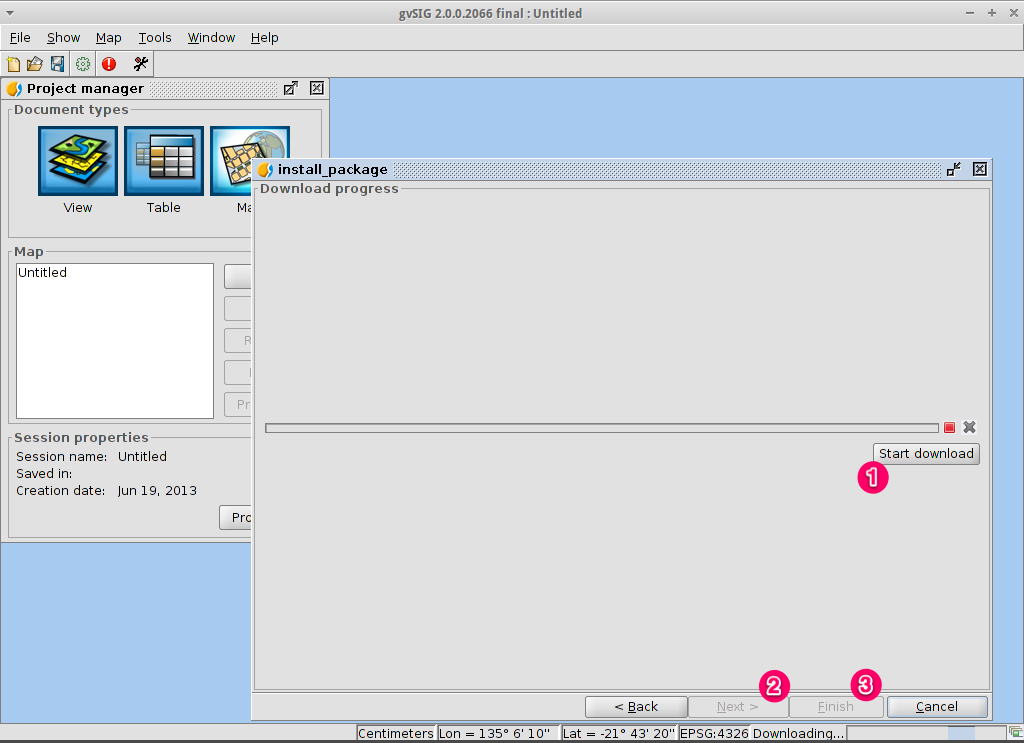
- Install an add-on (OpenStreetMap service)
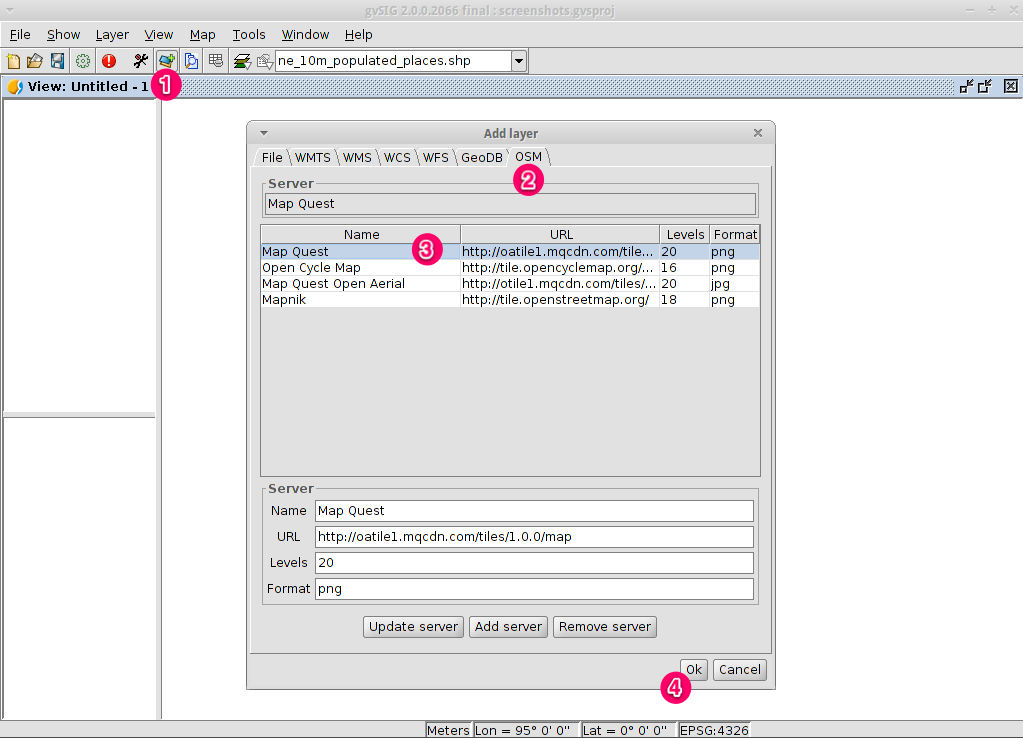
- Load a WTMS layer
Note
If gvSIG user interface becomes unresponsive, try Alt+f to open
the file menu for example. User interface should work again, then. This
bug only happens in the gvSIG distro for OSGeo-Live. It doesn’t appear
in a normal gvSIG installation.
Note
Note for version gvSIG 2.1.0-2218: To load raster files the user must
have write permission in the folder where the file is. Otherwise the
application will ask for a valid folder (with write permission). Since
the “user” user doesn’t have write permission in the “data” folder, it
will be necessary to select, when asked, a folder where the user does
have write permission, like for example, “/home/user”.
Select gvSIG from the application menu,
. The application usually takes
about a minute to startup.
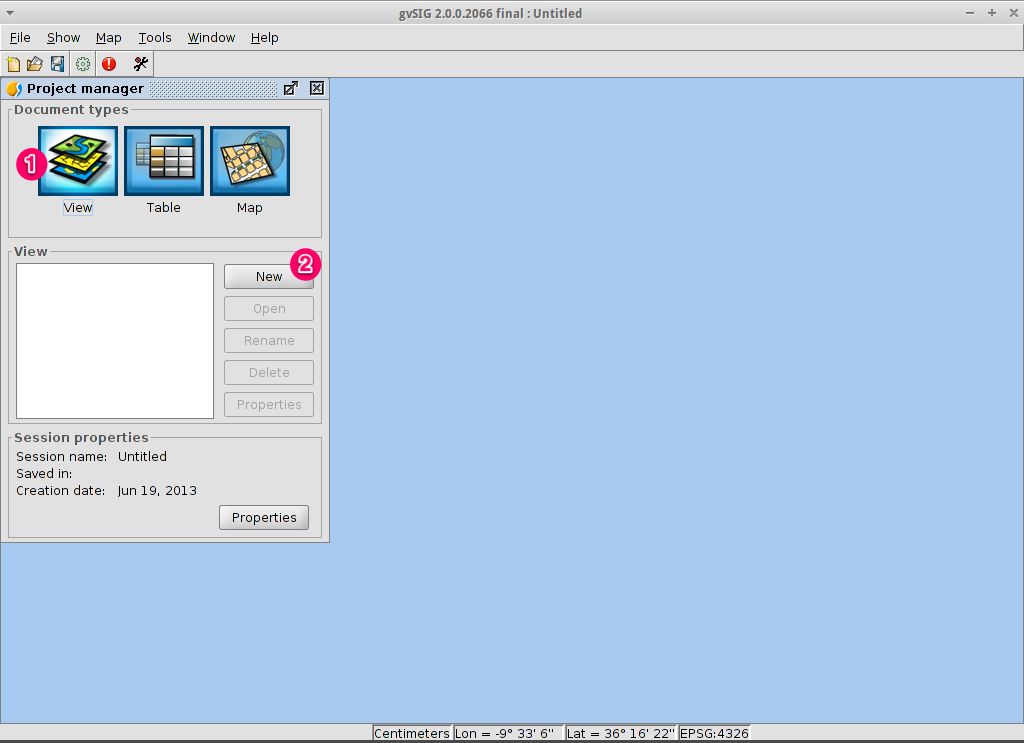
- By default gvSIG opens with an empty project file with the ‘View’ document
type selected. However, on OSGeo-Live, gvSIG has been configured to
start with a default project. Click on the New Project button or go to
. When prompted, you can select
Discard Changes as we won’t be using the last project.
- Click on the New button to create a view. It will be opened automatically.
- Select .
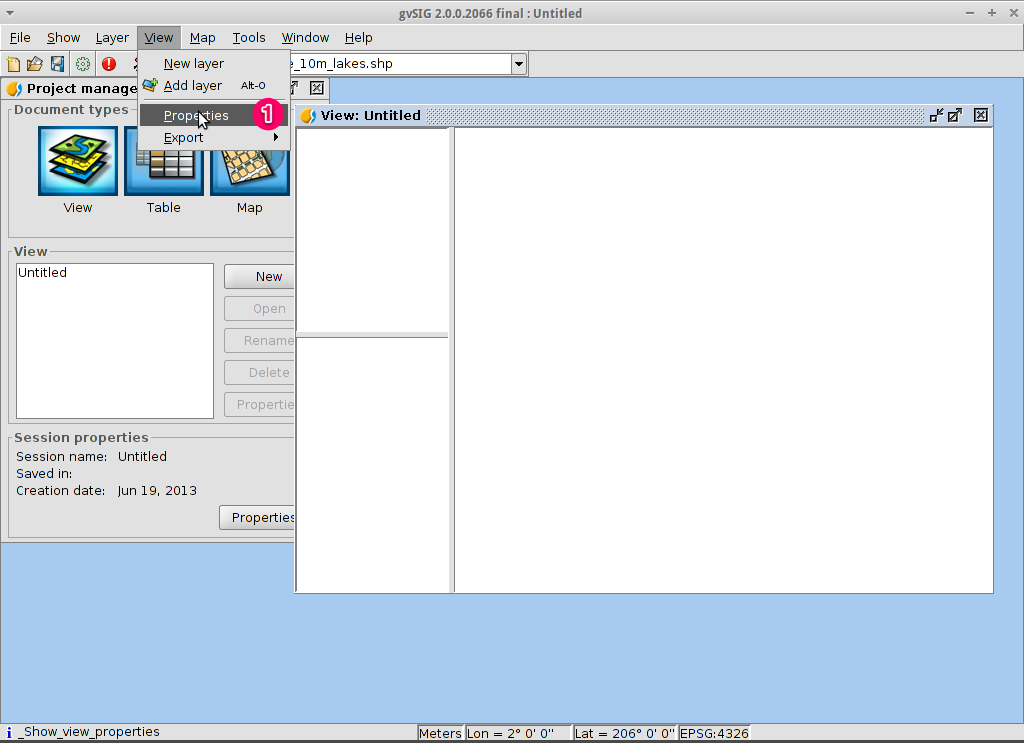
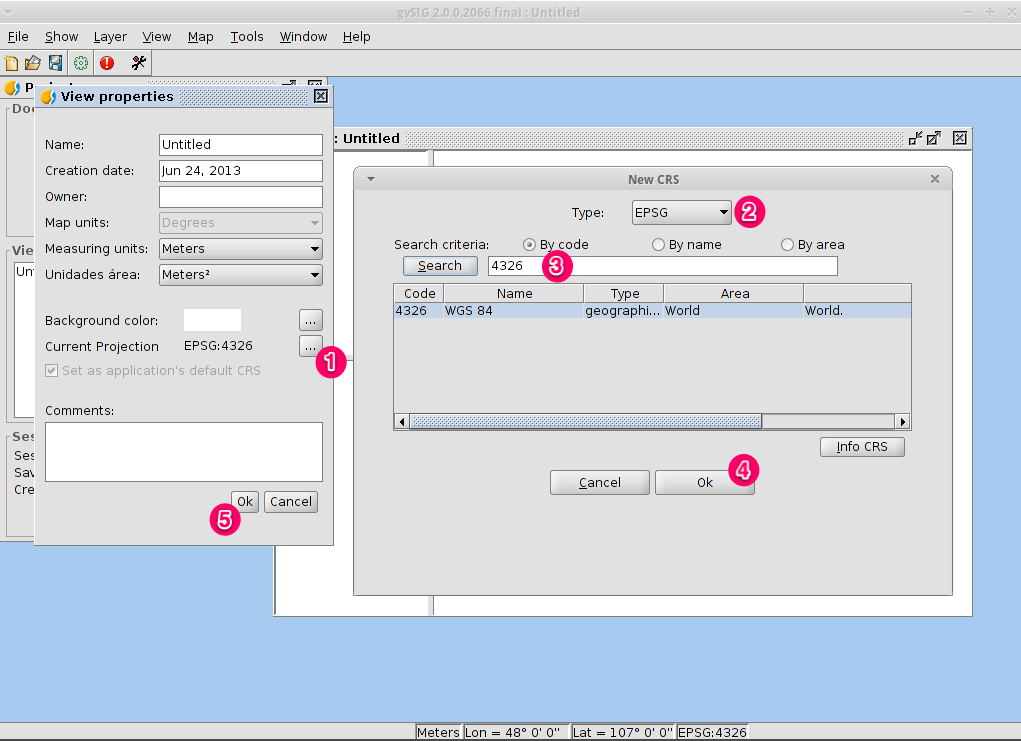
- Click on the ... button following the Current projection.
This will open the New CRS dialog.
- Using the dropdown list for Type, select EPSG.
- Enter the EPSG code for the Coordinate Reference System. For this example
we are using EPSG=4326, which is the WGS84 2D Geographic Projection. Then
click on the Search button. This will list the selected CRS in the table
below the search input field.
- Select OK to return to the View Properties dialog.
Note
The EPSG code is now 4326 and that the map units have changed to degrees.
- Select OK to return to the Project Manager.
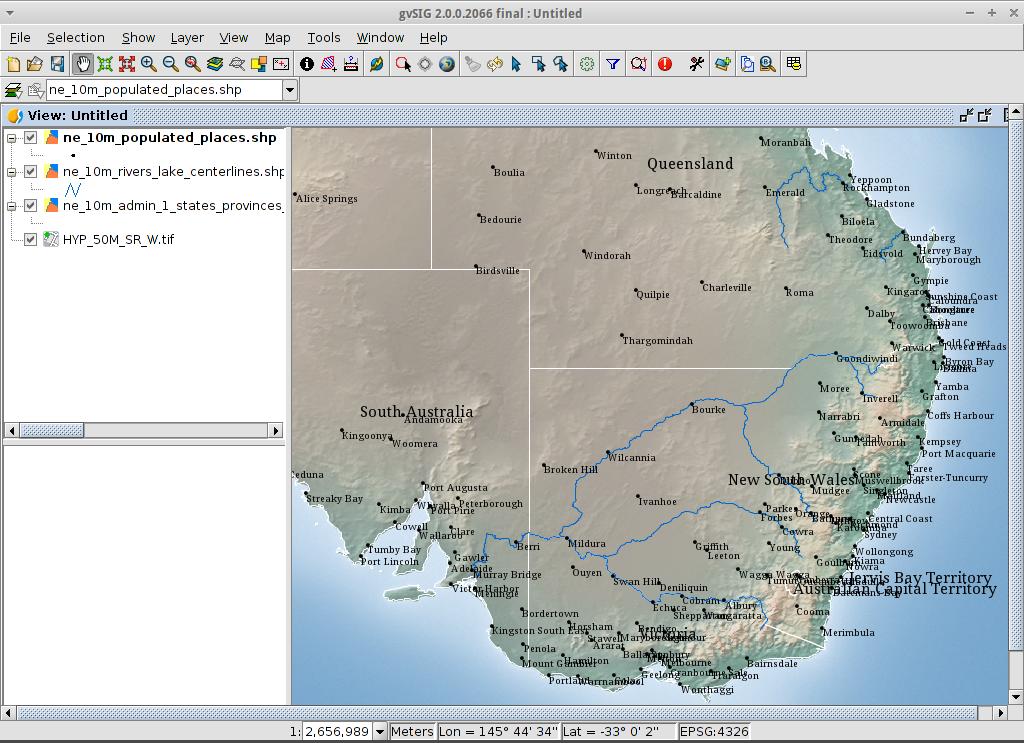
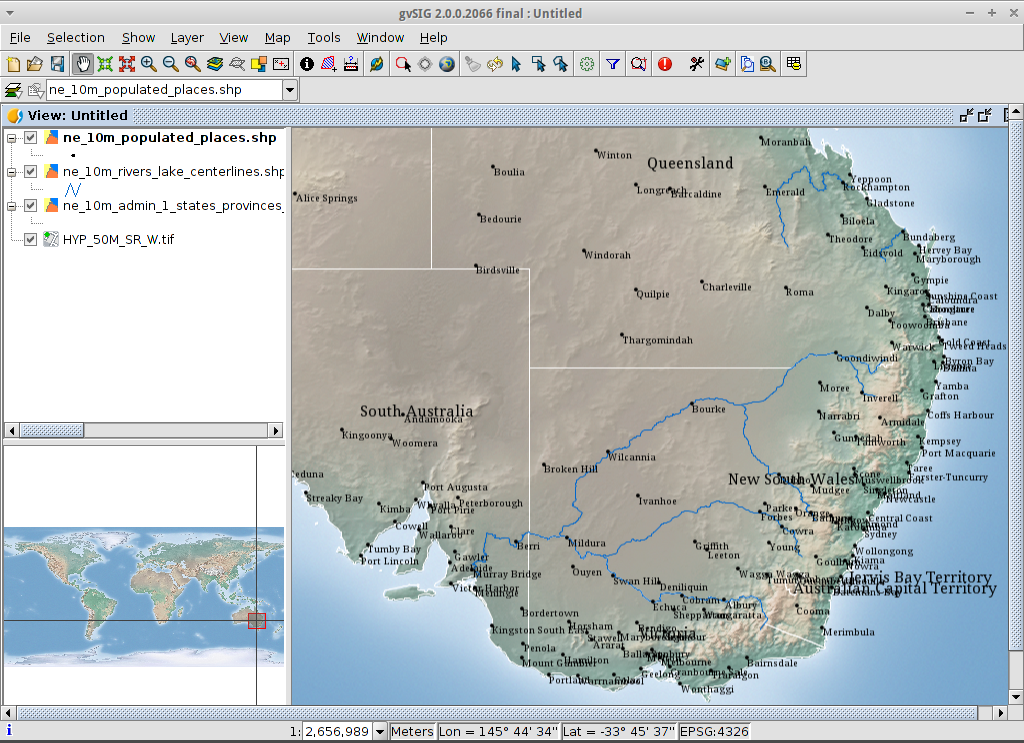
- The view window consists of three zones.
- The top-left cell contains a list of vector or raster layers being used in
the view (i.e. Table-of-Contents).
- The bottom-left cell displays the extent of the main view over a selected
vector file.
- The right cell is the main display area where raster and vector data is
rendered.

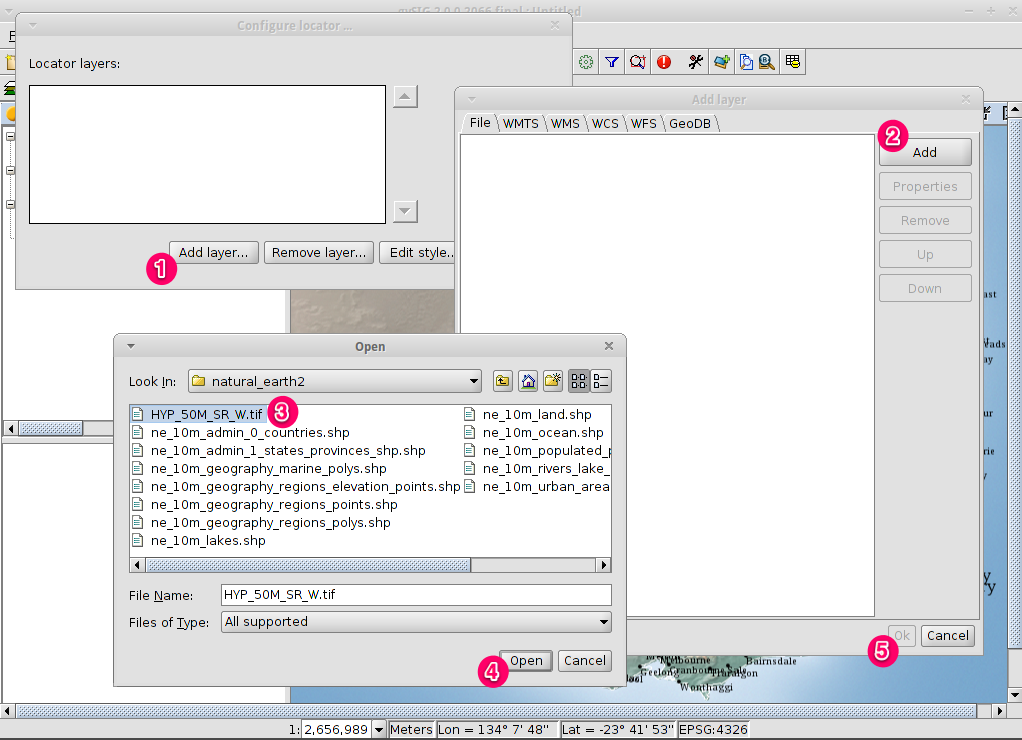
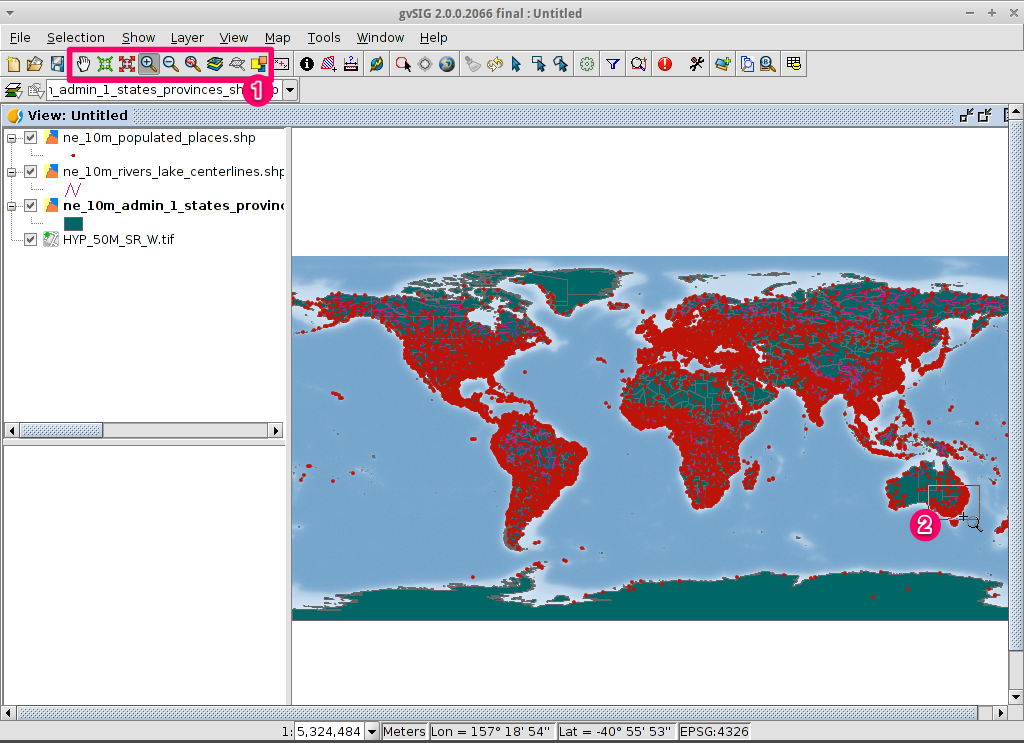
- Click on the Add layer icon in the main toolbar to open the Add layer dialog.
- Select Add in the Add layer dialog. By default the first tab is File
so the Open file dialog will appear.
- Drill down to the /usr/local/share/data/natural_earth2/ directory.
- Select the files as shown in the picture.

Note
By default all formats are shown so we can select both vector and raster files at a time by keeping pressed the CTRL key.
- Click on the OK button to return to the Add layer dialog.
- Click on the OK button on the Add layer dialog to return to the view.
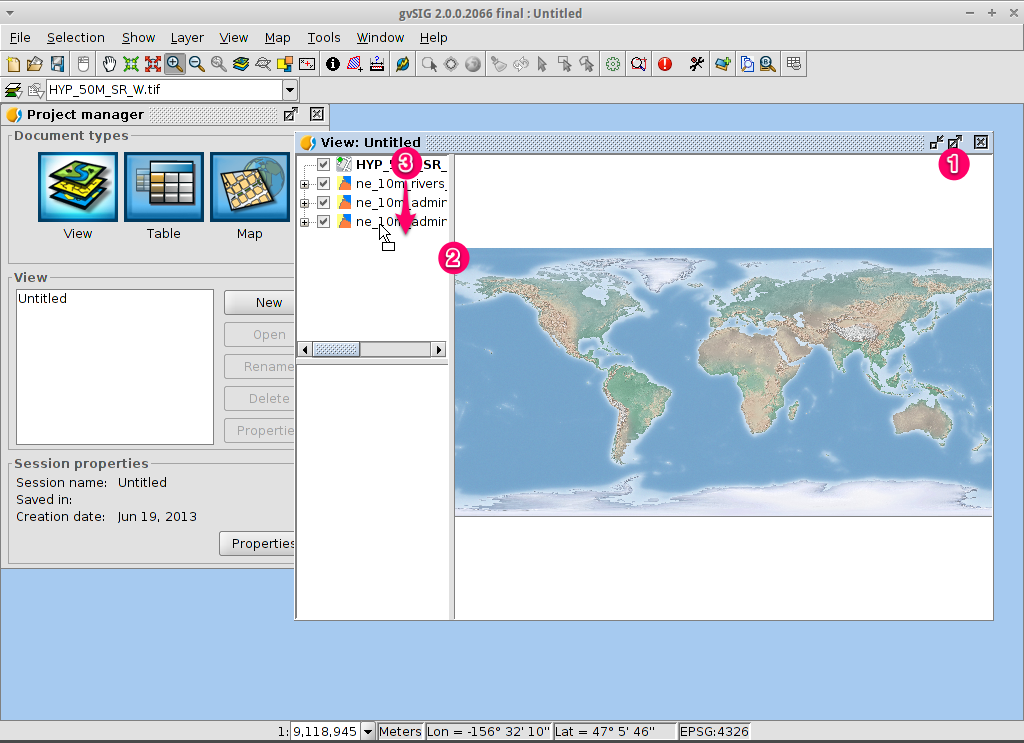
- Click on the Maximize icon for a better viewing of the data.
- The size of the Table-of-Contents column can be adjusted using the mouse to
help see long file names.
- In case the raster layer is on the top it should be moved manually to the bottom.
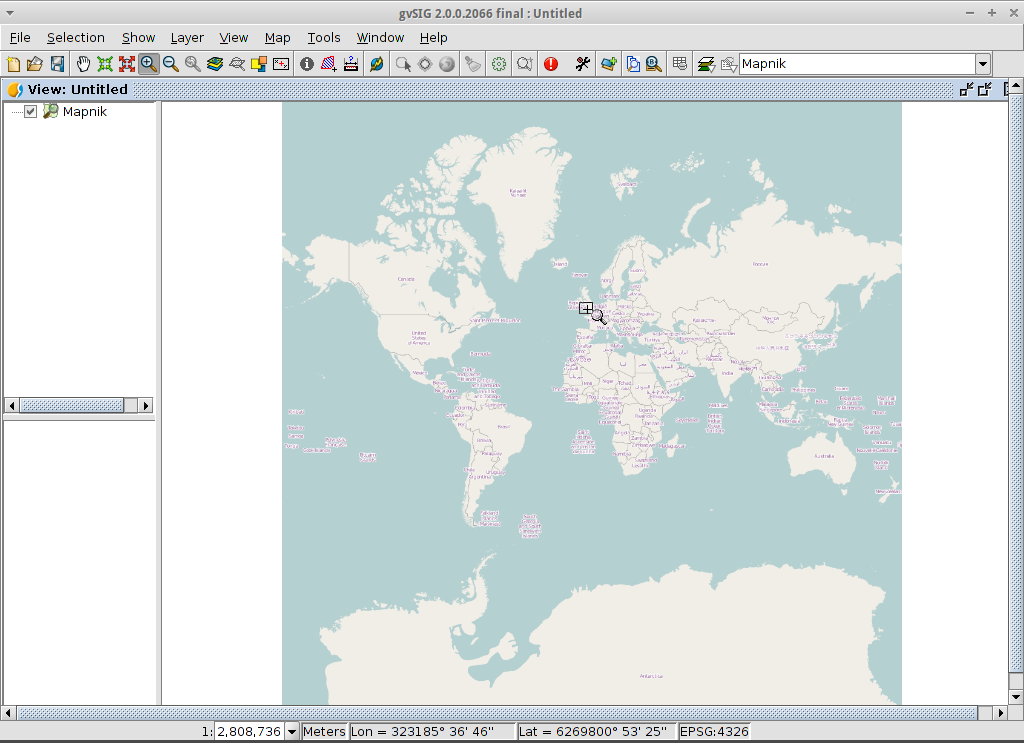
- By default the Zoom in tool is selected on the main toolbar.
- Use the mouse pointer to draw a bounding box around South-east Australia.
Do this by selecting the top-left corner of the bounding box, holding
down the left-mouse-button, and dragging the bottom-right corner of
the bounding box over the selected area. Release the left-mouse button once
you have the approximate area defined.
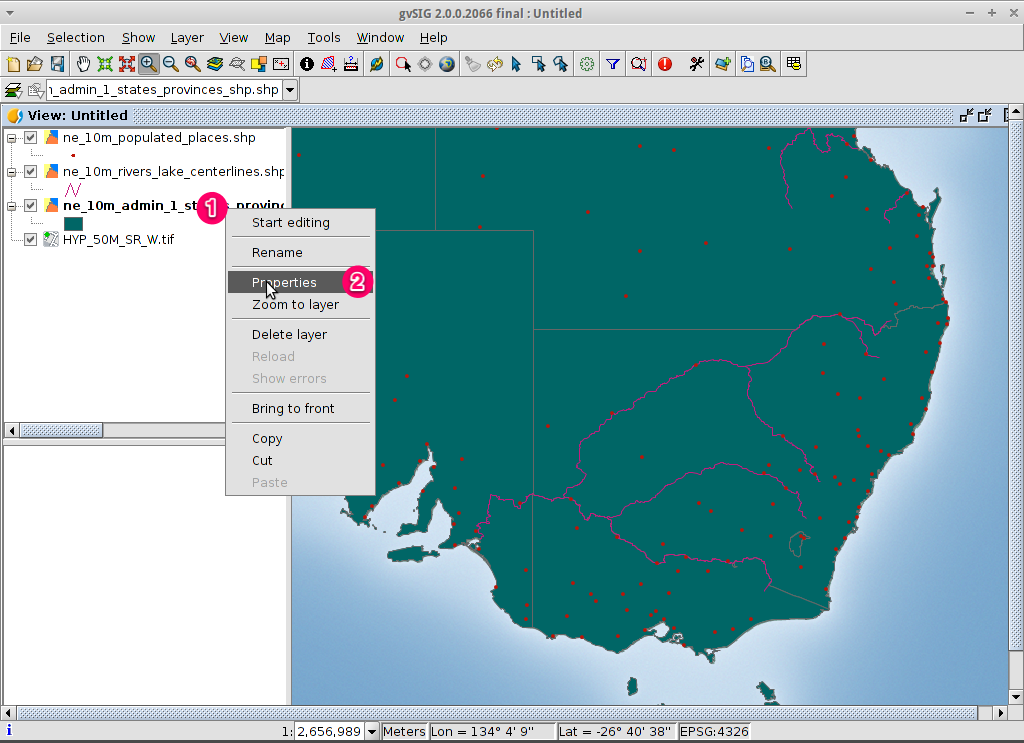
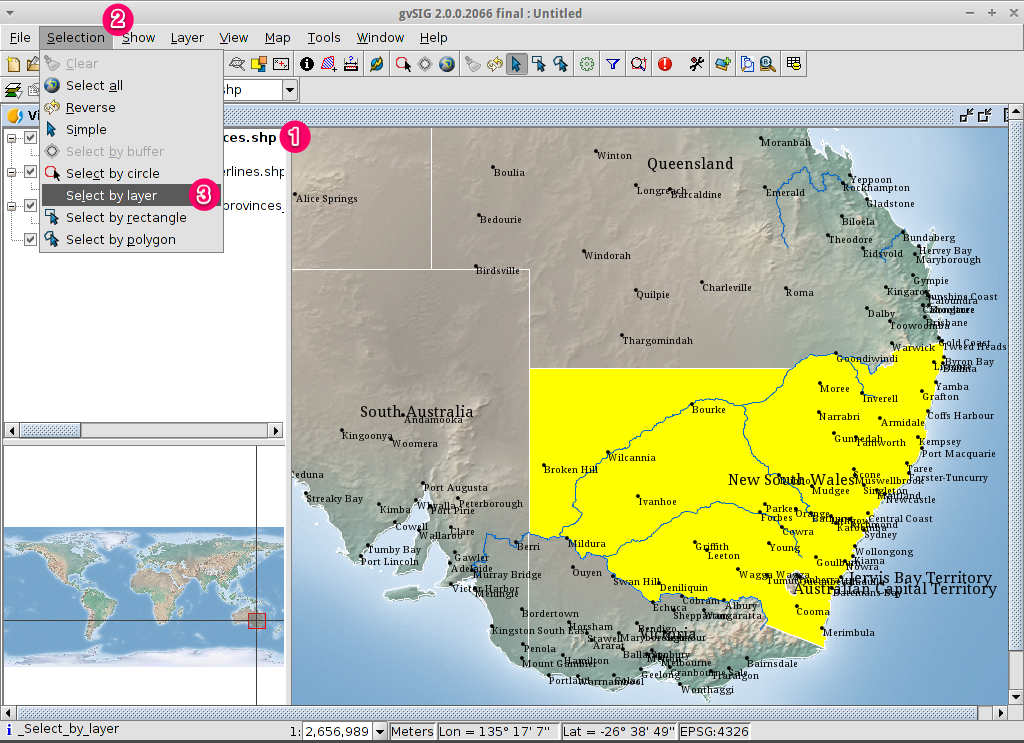
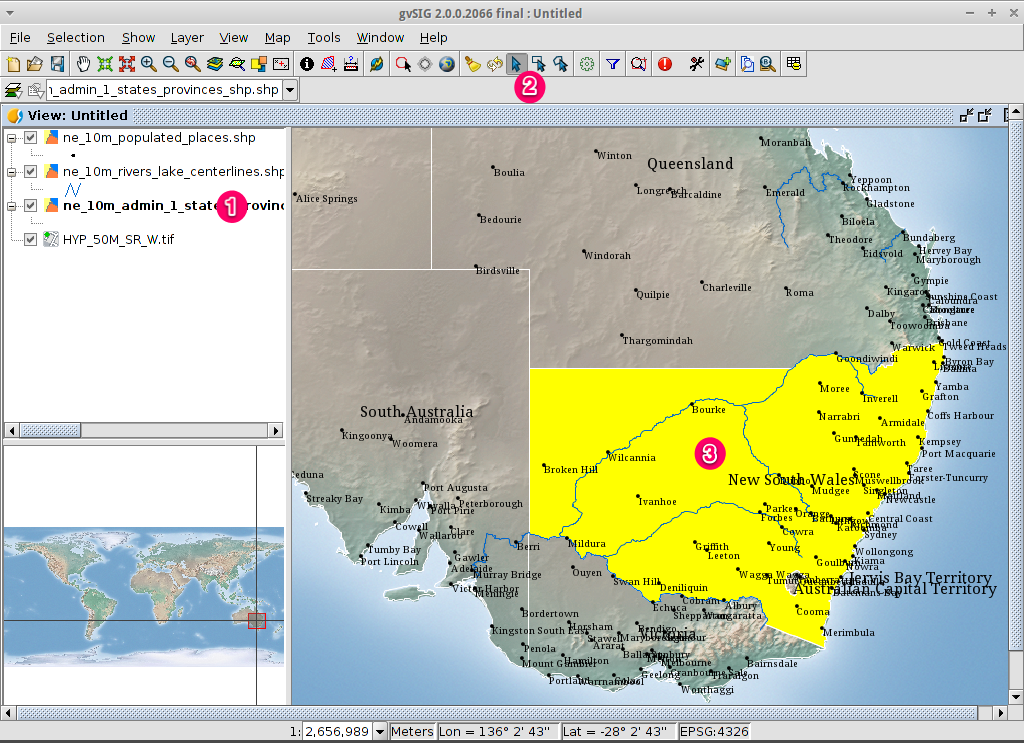
- Select the ne_10m_admin_1_states_provinces.shp layer using the
left-mouse-button.
- Select the Select by point icon in the main toolbar.
- Click the polygon representing the State of New South Wales. The polygon will
go yellow or some other colour depending on your user preferences.
- Change the first selection criteria using the dropdown boxes on the left-hand
side of the Selection by Layer dialog as shown in the picture.
- Change the second selection criteria as shown in the picture.
- Click the New set button to select towns within the selected polygon.
- Select the Cancel button in the Selection by Layer dialog to return
to the view.

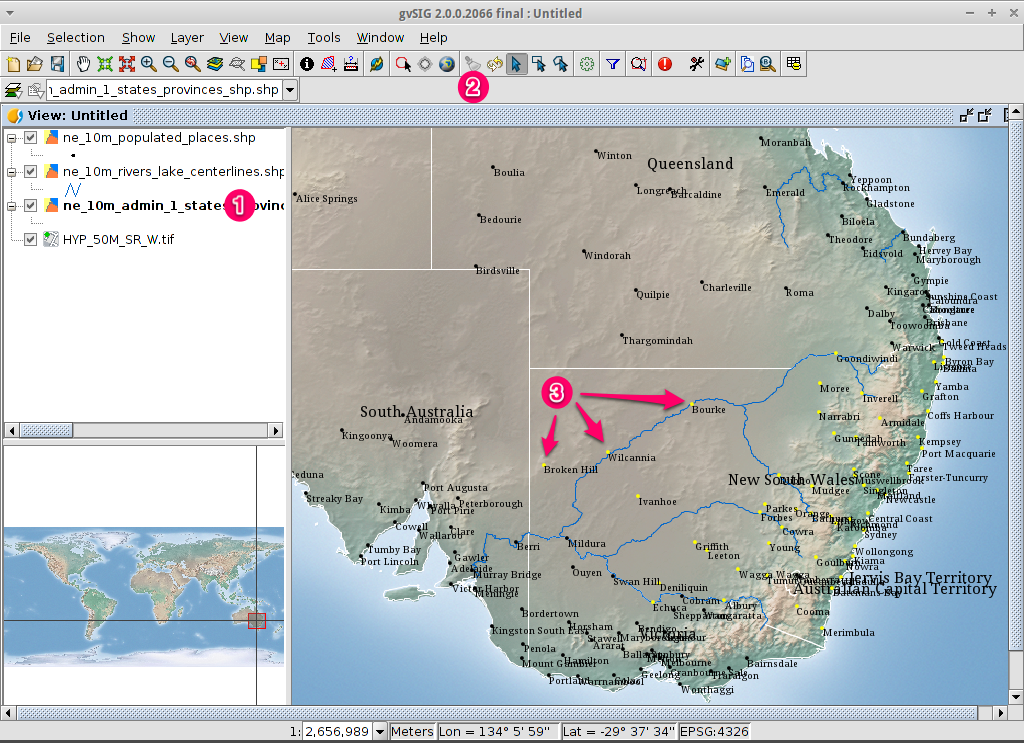
- Select the ne_10m_admin_1_states_provinces.shp layer using the left-mouse-button.
- Select the ‘Clear selection’ icon in the main toolbar.
- You can now see that the only those towns within New South Wales are selected.
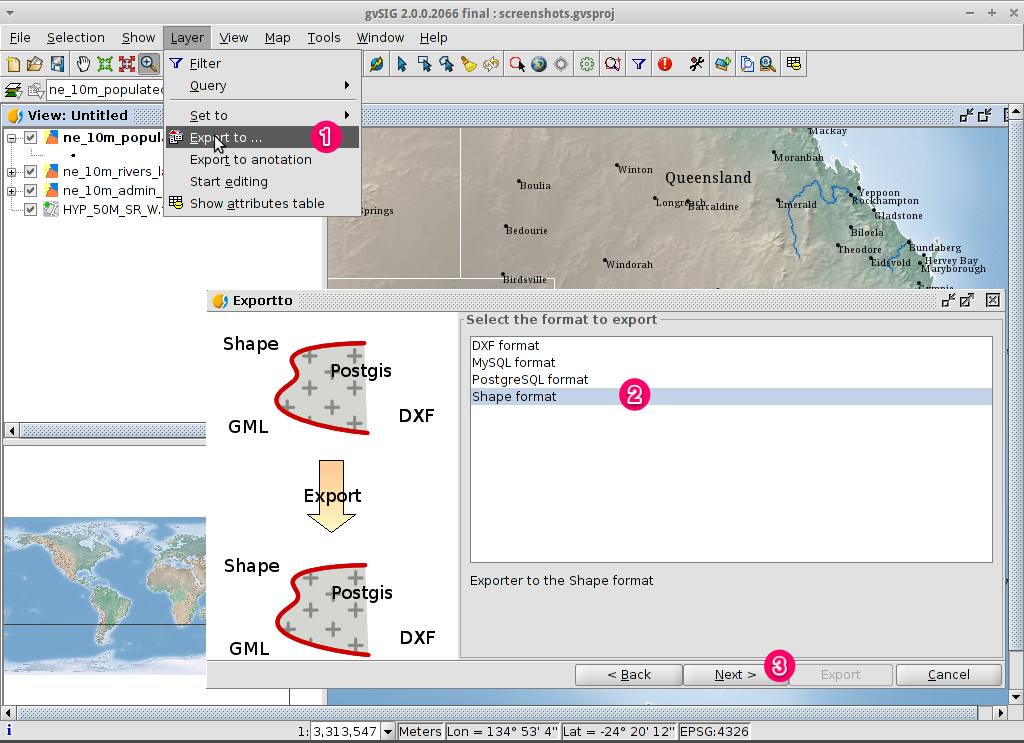
- Choose a folder and type the file name.
- Click on Open and then on Next.

- Choose the option Selected features in order to export only the towns of
New South Wales.
- Click on Export.
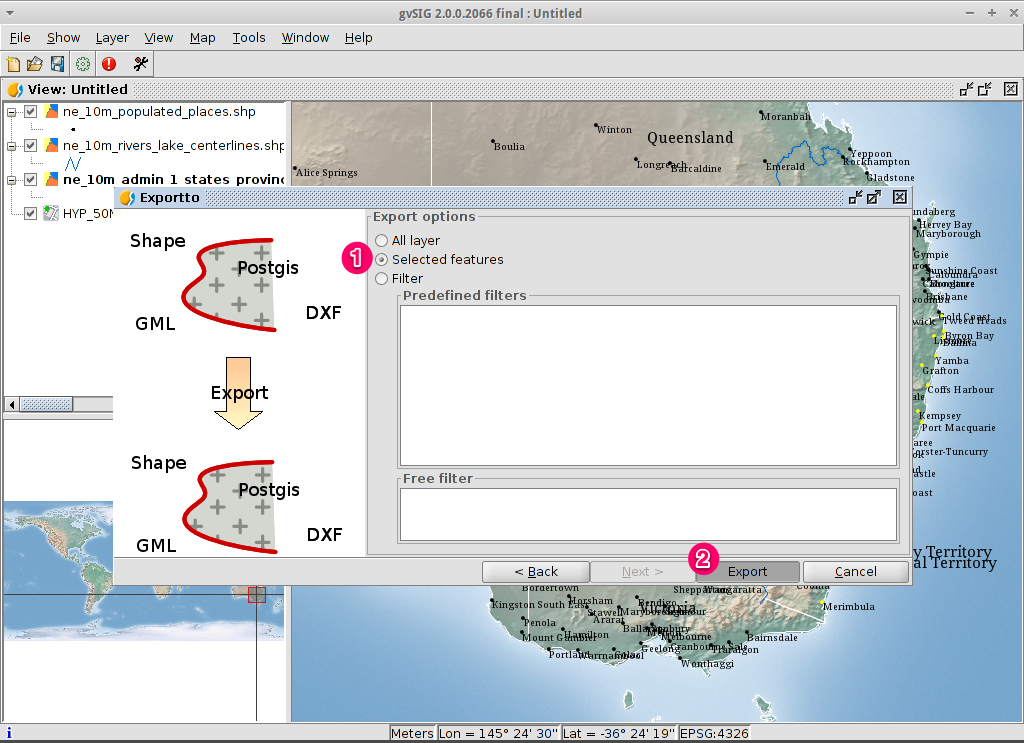
- The new layer has been added to the view.
- In order to check that the export was ok set the original file as invisible.
Only the towns of New South Wales should be shown.

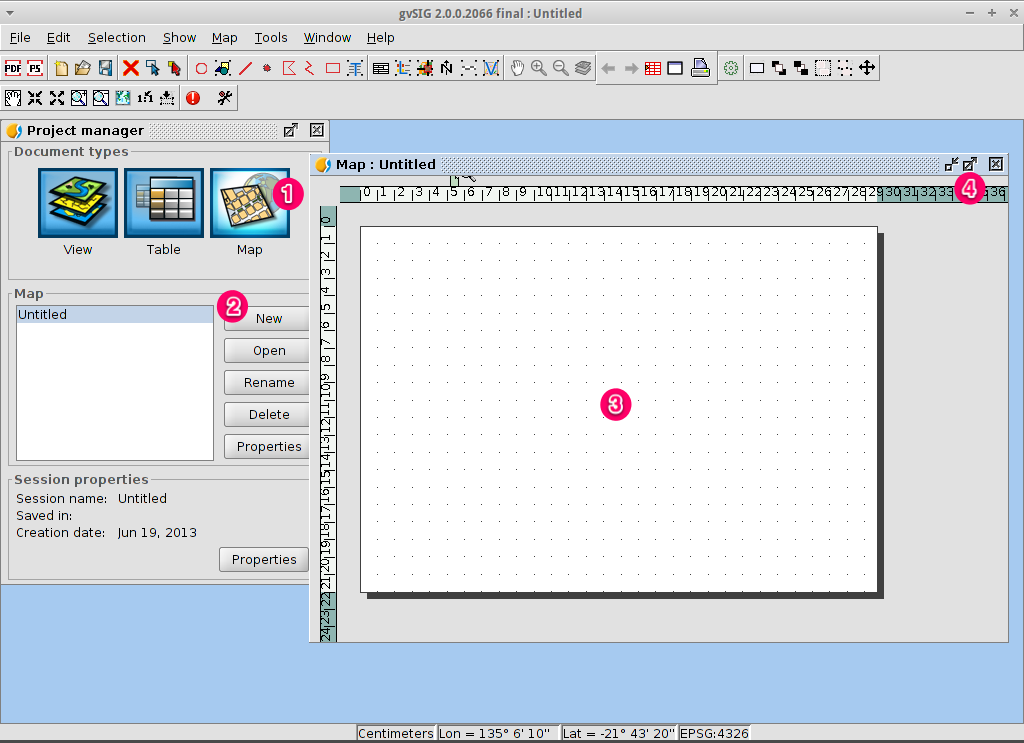
- Select the Map document type in the Project Manager.
- Click on the New button to create a map.
- An empty map will appear in its own window titled Map: Untitled - 0.
Note that a series of points are placed over the page. This is called a
grid or guides and are used to snap elements to while formatting your
map.
- Select the Maximise window icon to have the map occupy the entire
screen.
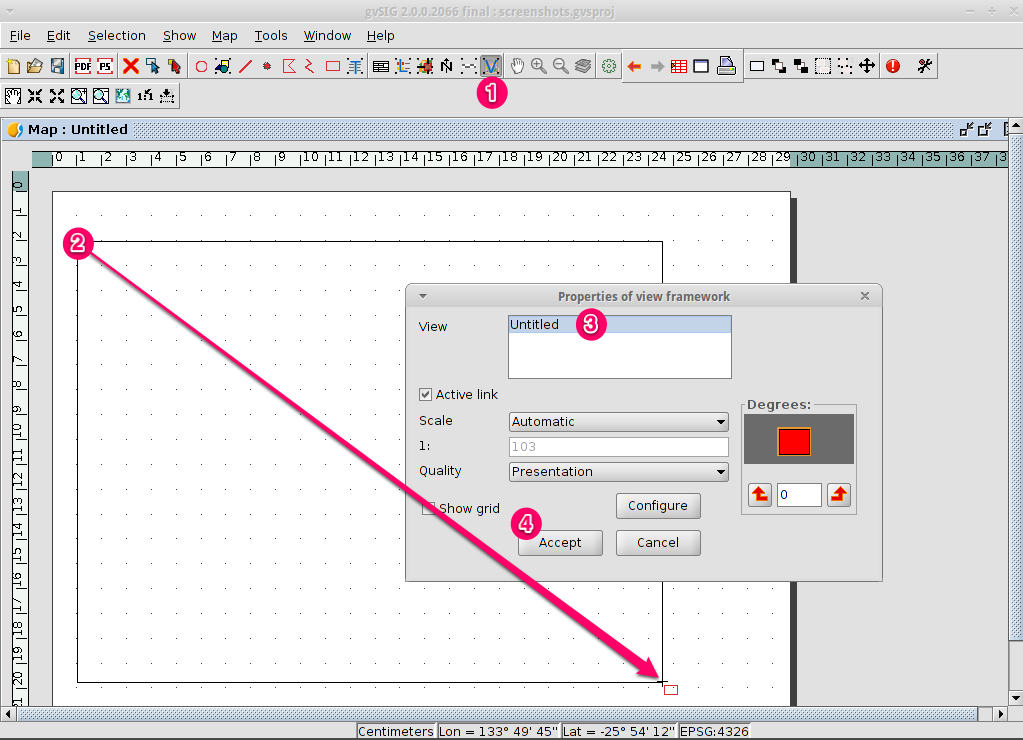
- Click on the Insert view icon in the main menu
- Create a bounding box representing the extent of the map on the page by
clicking on the empty map while holding down the left-mouse-button and
dragging out the box, only letting go once the the area to be used is
complete. This opens the Properties of view framework dialog.
- Select the view created earlier.
- Select the Accept button to exit and return to your map.
- Additional elements like a scale and north arrow can be added to the map
using the icons in the main toolbar or with the submenus in the menu.
- The map can be printed or exported to PDF or Postscript for incorporation
into other works.
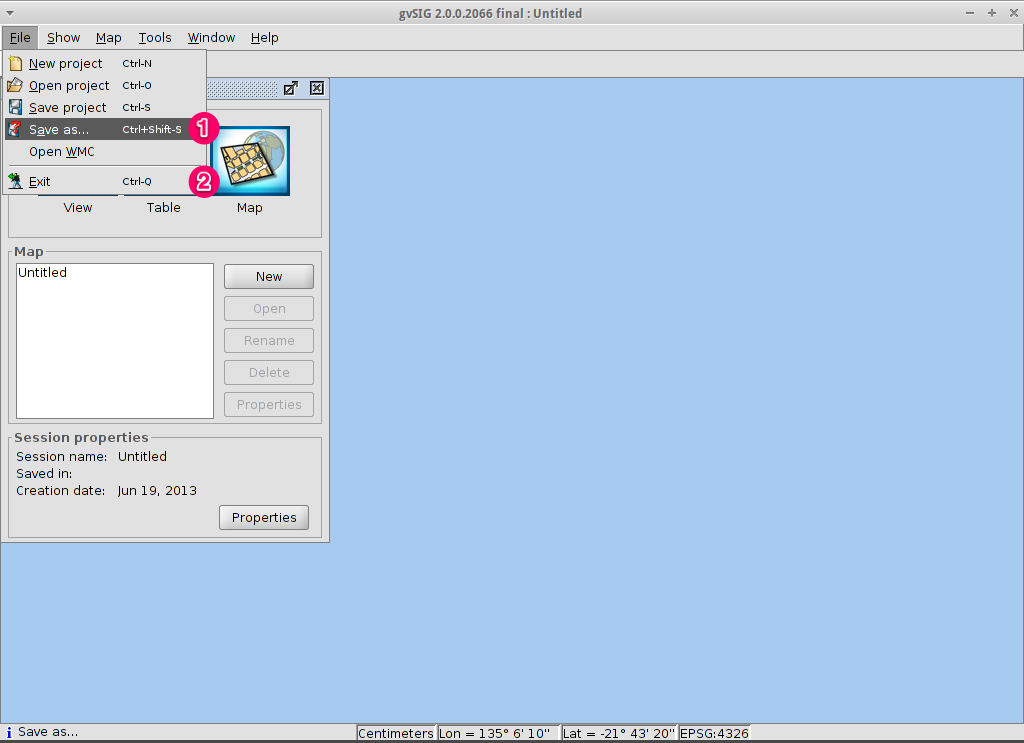
- Select the Close window icon to return to the Project manager

- Projects can be saved for use later by using the
menu option, or
- Projects can be exited or closed by using the menu option.
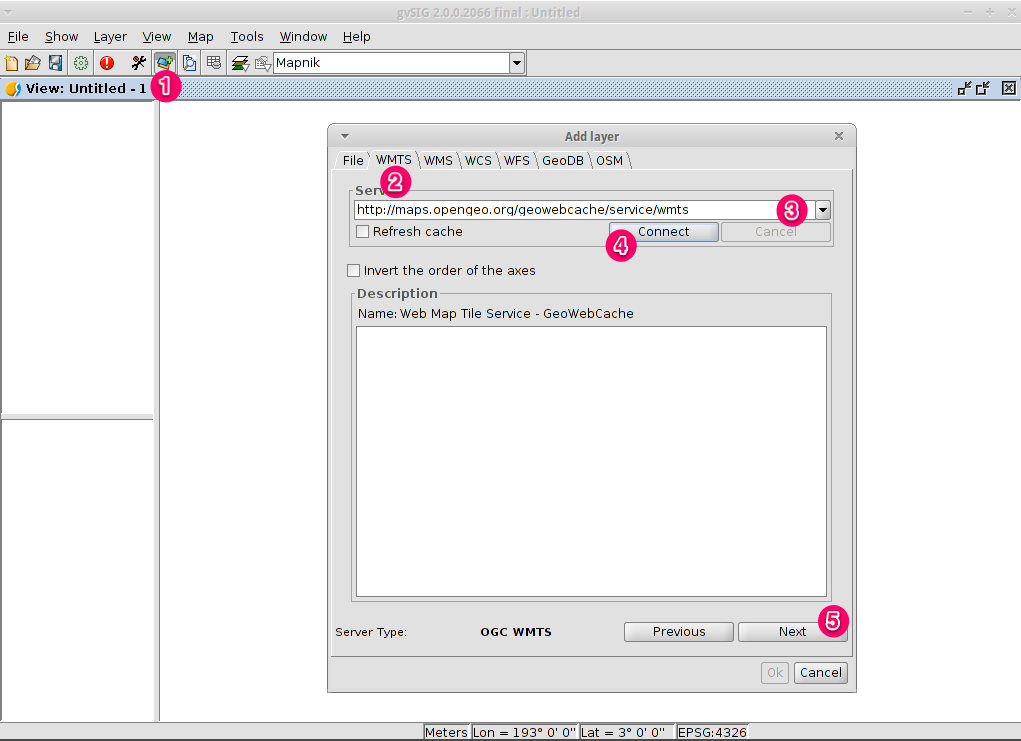
WMTS is a evolution of WMS OGC standard based on tile management.
- Within a view, click on the Add layer… button.
- Choose the WMTS tab.
- Choose the URL shown in the picture.
- Click on Connect.
- Click on Next.
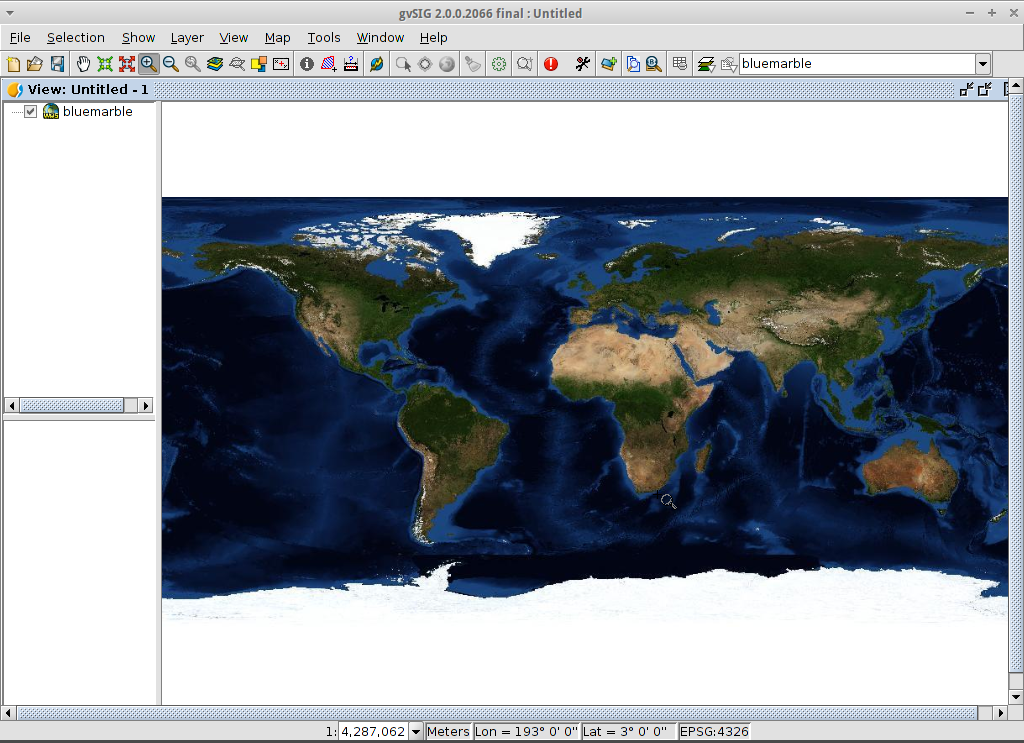
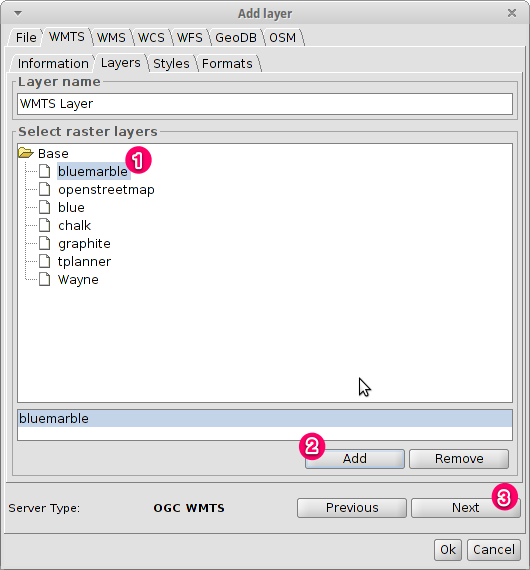
- Select one of the available layers (e.g. bluemarble)
- Click on Add.
- Click on Next.
A new layer has been added to the view.